One Story, Two Dozen Outlets
On July 11, half the outlets still covering the NEET-UG re-exam were running the same serviceable update: final answer key and results expected around July 20, rely on the official portal. Hindustan Times ran something different. It had the details of the CBI’s upcoming charge sheet — thirteen private individuals, three of them contracted paper-setter teachers, and no NTA officials implicated. Nobody else carrying exam updates that day mentioned the charge sheet at all.
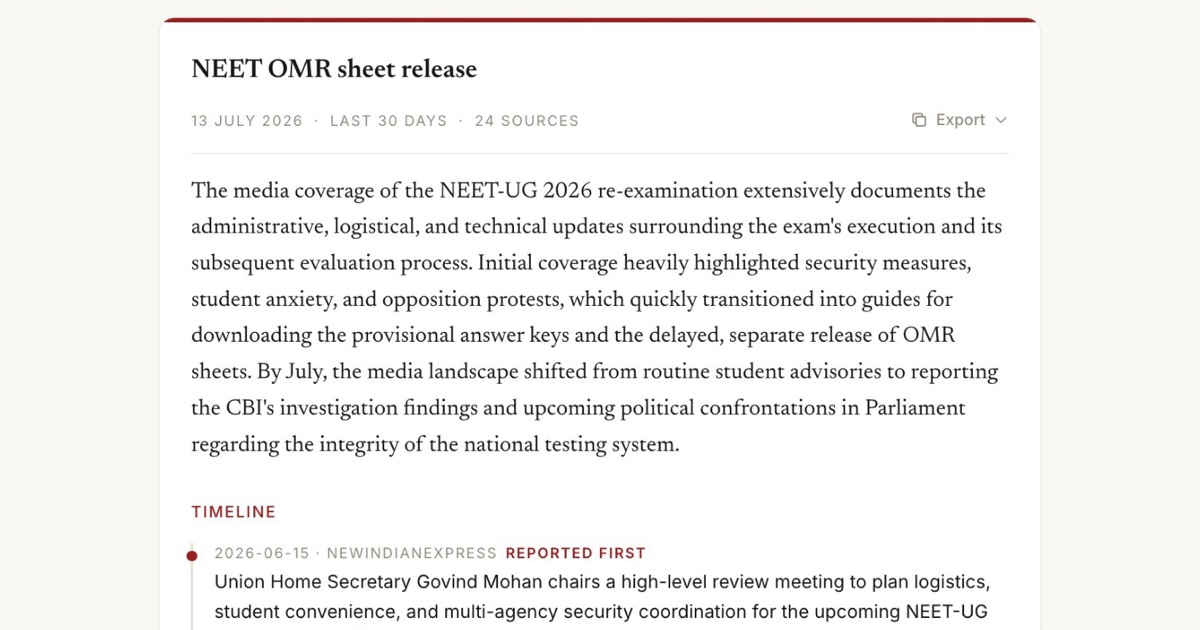
I didn’t find that by reading twenty-four articles side by side. A Coverage Report found it — the feature the last post ended on, and the thing Samvad is now built around. You give it a story, and a few minutes later a background worker hands you a document: a dated timeline of how the story unfolded and who reported it first, plus a four-way read of how the coverage differed across outlets — including what some carried that the rest dropped. The NEET report’s timeline ran from a Home Secretary security meeting in mid-June to the OMR sheets landing on the portal the morning I ran it.
These are my notes on building it, and on the ways it went sideways between the first prototype and production.
Deciding what not to build
Before writing any code I went looking at who already does “compare how outlets covered a story.” The answer was humbling. Ground News does it globally, with bias ratings and blind-spot flags. India has a player doing left/centre/right comparison across fifty-plus sources. Both are polished products with native apps and years of head start. If Samvad tried to be a comparison feed you open and browse, it would lose on corpus size alone, before distribution even came up.
What none of them produce is a document. Their comparison ends at the screen — you read it there, and then it’s gone. The people I built Samvad for make things about the news: journalists pitching a story, researchers checking framing, YouTubers scripting a video essay. For them the comparison is raw material, and raw material needs to leave the app. So the Coverage Report is built as a research deliverable: run it on a story, get back a cited document you can export and take into your own work.
Choosing that lane settled a lot of decisions downstream. It killed a whole category of features I might have wasted a month on, like feeds and bias meters. And it turned one requirement into a hard rule: every claim in the report has to name the outlets and link the articles, because whatever the reader produces next inherits those citations.
Retrieval, turned inside out
Q&A retrieval — the thing the last post rebuilt — hunts for the twelve most relevant, most recent articles for a question. A report wants roughly the inverse: the whole arc of one story rather than the best matches for a query. It keeps the full time window instead of biasing toward this week, and casts a much wider candidate pool. The picks then get spread deliberately across outlets, so one prolific publisher can’t fill every slot. Everything gets ordered by publication date, and that ordering becomes the spine of the timeline.
The only reason this was cheap to build is the last rebuild: retrieval was already plain code with no model in the loop, so the report path reuses the same parts — the hybrid search, the full-body fetch, the reranker, the relevance floor — with a different selection policy bolted on the end. It went in as a handful of extra parameters on functions that already existed, and the Q&A path didn’t change at all. Most of the real work was choosing defaults, like how wide the pool should be and how hard to push for outlet variety.
The timeline thought everything was “first”
The timeline carries a “reported first” badge, because for a journalist “who broke it” is half the value of the document. In the first version I let the synthesis model decide which rows deserved it. It marked nearly all of them. On a story with many developments, every row is technically someone being first to something, so the model — asked to flag firsts — flagged almost everything. By the instructions I’d written, it wasn’t even wrong. It just made the badge meaningless.
The fix was to stop asking. Publication dates were sitting in the data all along, so now the timeline is ordered by date and the earliest report carries the badge. The model has no say. It’s the same mistake the last post was about, just smaller.
Omission claims have to cite their way in
The analysis half of the report reads the coverage along four axes: how the framing differs across outlets, how the narrative shifted over time, how the story propagated from outlet to outlet, and what some outlets emphasised that others dropped. On the NEET report the shift axis traced coverage that started with pre-exam anxiety and protests, turned into answer-key download guides, and ended in the CBI’s findings and a coming fight in Parliament — phases I’d half-noticed as a reader and never seen laid out.
The omission axis is the sharpest of the four for a journalist. It’s also the most dangerous claim the system can make, because it’s a claim about absence. “Outlet A reported this and the others didn’t” is easy for a model to assert. Checking it means going and reading the others.
So omission claims are held to a stricter rule than everything else in the report. The synthesis is only allowed to assert one when it can cite the specific articles on the “carried it” side and the contrast is clear from the set — and the axis is allowed to come back empty. After generation, a deterministic pass strips any claim whose citations don’t resolve to articles actually in the set, on every axis. A contrast that can’t produce its receipts gets dropped rather than softened into a vaguer sentence, and sometimes that costs a report its most interesting-sounding finding. I’ll take it — the July 11 charge-sheet detail at the top of this post survived those checks, which is exactly why I was comfortable opening with it. The one hardening step reports don’t get yet is the Q&A pipeline’s Critic reading them back; that’s first on the list when I pick development back up.
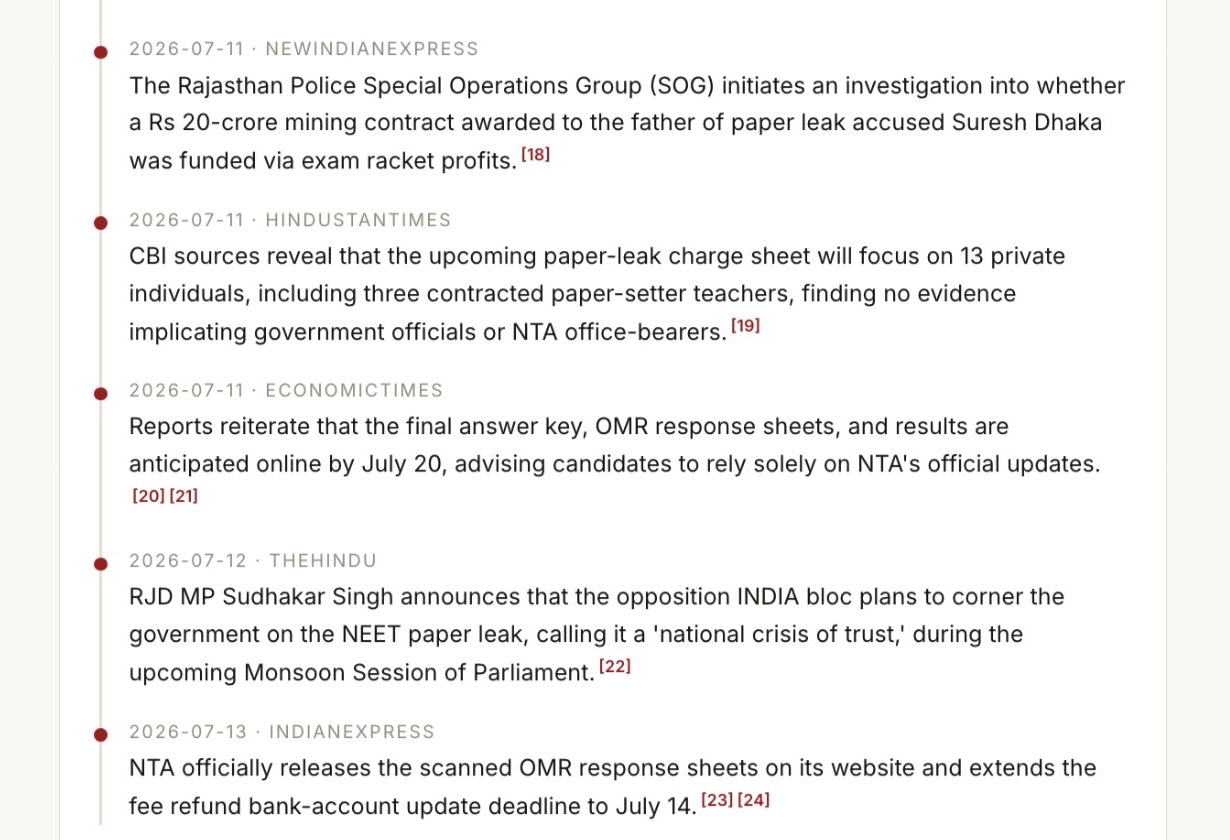
The stretch of the timeline this post opened with: the July 11 charge-sheet beat, and what everyone else ran around it.
What production charged for the lesson
Reports generate in the background. Reading a couple dozen full articles and synthesising a multi-section document is too slow for request-response, so the app enqueues a job in a Postgres table, a worker claims it, and the user is only charged once the report is actually ready. Same queue-without-a-queue-service pattern as the rest of the system.
The first surprise arrived with the first real production report: it cost about two and a half times my estimate. The synthesis model is a thinking model, and thinking tokens are billed at the output rate — but they don’t appear in the output token count my cost instrumentation was reading, so my estimate and my telemetry were both undercounting in exactly the same way. I fixed the instrumentation, then fixed the margin with the price: a report went from five credits to eight. Turning the thinking down would have been cheaper, but the thinking is visibly where the report’s grounding and specificity come from, and degrading the one feature the product stands on to save a few rupees was an easy no.
The second surprise was better. Within a day of the worker deploying, my ingestion alerts started firing — the backlog of unprocessed articles was aging past its threshold. The product had zero users and nothing was generating reports, so the alert made no sense until I looked at the machine. The report worker had become the fourth container on a VM with one gigabyte of RAM, and merely importing its dependencies makes it a big process even when idle. Four containers didn’t fit in that. The kernel kept killing one, Docker kept restarting it, the restart loop ate the machine’s small CPU allowance, and the ingestion workers quietly starved. One machine-size bump fixed it.
Shipping meant cutting
V2’s plan included a public showcase page: pre-generated reports anyone could read without signing up. I cut it to ship. It was a whole extra surface — public routes, plus pre-baked reports on a refresh schedule — in service of cold ad traffic I’m not buying, when the actual plan is to put reports directly in front of journalists. The landing page shows a real report excerpt instead, and a new account’s free credits cover trying the real thing.
With V2 out, I’ve stopped building for a while. The tuning list is sitting right there in my notes, but the next problem isn’t in the codebase: Samvad now has a feature I genuinely haven’t seen elsewhere, and almost no one using it. So I’m spending the time talking to journalists instead, which I’m finding much less comfortable than refactoring a retriever.
The whole thing is live at ask.samvadhq.com — new accounts get 20 free credits, which covers a couple of Coverage Reports. If you followed some story closely over the past few weeks, run a report on it and see whether the timeline matches your memory of events — and whether the omission axis catches something you missed. Mine did, on July 11.